Introduction
Having a centralized logging system IS critical for diagnosing issues, monitoring performance, and responding to security events in today’s systems. The ELK Stack—Elasticsearch, Logstash, and Kibana—offers a powerful suite for ingesting, analyzing, and visualizing log data. This blog helps you in Setting up ELK Stack on AlmaLinux 9, so you can collect logs from multiple sources and analyze them through a unified dashboard.
Prerequisites
Before you begin, make sure you have:
- An AlmaLinux 9 server (bare metal or VPS) with at least 4 GB RAM (8 GB+ preferred).
- A root/sudo privileges.
- At least 20 GB of free disk space (for Elasticsearch indices).
- Firewall rules allowing inbound TCP ports: 5601 (Kibana), 9200 (Elasticsearch), 5044 (Logstash / Beats).
Once your environment is ready, you can proceed with installing each component of the ELK Stack.
Step‑by‑Step Installation
Install Java (OpenJDK)
Elasticsearch and Logstash require the Java runtime. Use the following to install OpenJDK 21:
dnf install -y java-21-openjdk-develThen check:
java -versionEnsure it shows version 21 (e.g. openjdk version “21.0.7” …)
Add Elasticsearch Repository & Install
Import the GPG key:
sudo rpm --import https://artifacts.elastic.co/GPG-KEY-elasticsearchCreate /etc/yum.repos.d/elasticsearch.repo and insert:
nano /etc/yum.repos.d/elasticsearch.repo[elasticsearch]
name=Elasticsearch repository for 9.x packages
baseurl=https://artifacts.elastic.co/packages/9.x/yum
gpgcheck=1
gpgkey=https://artifacts.elastic.co/GPG-KEY-elasticsearch
enabled=0
autorefresh=1
type=rpm-mdThen install Elasticsearch and enable it:
sudo dnf install --enablerepo=elasticsearch elasticsearch
sudo systemctl enable --now elasticsearch
During installation, you’ll see a generated password for the elastic built‑in superuser.
The generated password for the elastic built-in superuser is : *******************Kindly note in order to login into the elastic dashboard.
Install Logstash
Using the same Elasticsearch repo:
sudo dnf install --enablerepo=elasticsearch logstash
sudo systemctl enable --now logstash
Configure a basic pipeline at /etc/logstash/conf.d/02-beats-input.conf :
input {
  beats {
    port => 5044
  }
}

filter {
  # Add any grok, date, or mutate filters here
}

output {
  elasticsearch {
    hosts => ["http://localhost:9200"]
    index => "logs-%{+YYYY.MM.dd}"
  }
}
Restart Logstash to load changes:
sudo systemctl restart logstashInstall & Configure Kibana
Install via:
sudo dnf install --enablerepo=elasticsearch kibanaEdit /etc/kibana/kibana.yml and set:
server.host: "0.0.0.0"
elasticsearch.hosts: ["http://localhost:9200"]
Enable and start:
sudo systemctl enable --now kibanaTest the ELK Setup
Access Kibana via browser: http://<elk-server-ip>:5601.
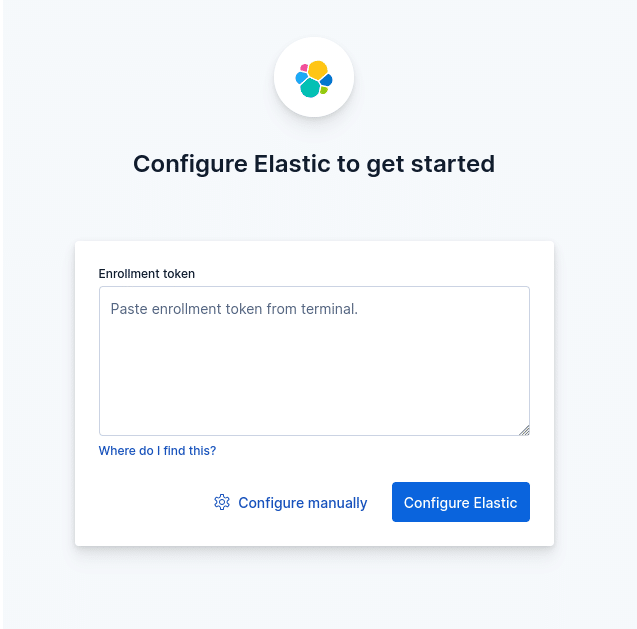
You’ll be prompted for an enrollment token:
/usr/share/elasticsearch/bin/elasticsearch-create-enrollment-token -s kibanaNext, get the verification code:
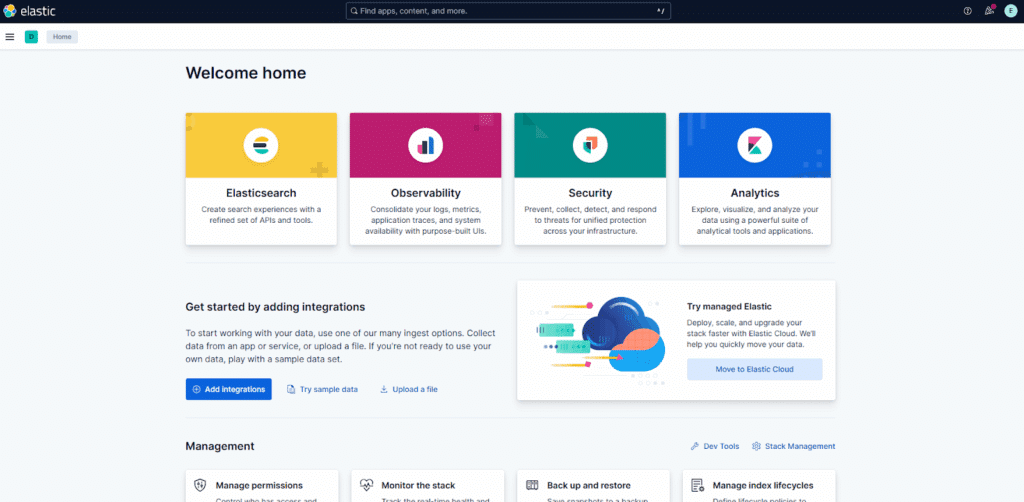
/usr/share/kibana/bin/kibana-verification-codeEnter those credentials in the browser, then log in using:
Username: elastic
Password: the one generated when Elasticsearch was installed
Deploy Filebeat to Ship Logs
On each node you wish to monitor:
sudo dnf install -y --enablerepo=elasticsearch filebeatEnable, for example, the Apache module:
sudo filebeat modules enable apacheIn /etc/filebeat/filebeat.yml, configure output:
output.logstash:
  hosts: ["<elk_server_ip>:5044"]
  ssl.enabled: false
Enable and start Filebeat:
sudo systemctl enable --now filebeatVerify & Visualize in Kibana
Log into Kibana, head to Stack Management → Data Views, and create a pattern like logs-*.
Then go to Discover to inspect ingested logs in real time.
You may build visualizations and dashboards under Analytics to monitor your infrastructure and application logs.
Conclusion
Setting up the ELK Stack gives you a robust, centralized logging ecosystem. With dashboards, alerts, and search capabilities, you gain deep visibility into your systems and are better equipped to troubleshoot, monitor performance, and maintain security. Harnessing the ELK Stack can transform your logging strategy into a proactive, insightful tool for your operations.
If you need expert help with Setting Up ELK Stack on your servers or want to ensure a smooth and secure deployment on AlmaLinux 9, our team at Skynats is here to assist. With our specialized Linux Server Management Services, we provide end-to-end support for installing, configuring, and maintaining monitoring and logging solutions tailored to your infrastructure needs. Contact us today to get professional assistance and keep your servers running at peak performance.